The ERP Solution for the Year” 2025 in Agtech Breakthrough Awards 2025


Key Takeaways
- Pick the Costing Method First: Standard costing makes margins comparable from batch to batch, but the standards need regular review or they drift away from what the plant actually spends.
- Cost Per Usable Pound, Not Per Purchased Pound: Trim, cook loss, and shrink raise the real cost of every sellable unit. Normal loss belongs in the standard, and abnormal loss belongs in the period’s expense.
- By-Products Move Product Margins: In a textbook dairy example, two accepted allocation methods split the same joint cost differently, and butter showed a $10,600 loss under one and an $8,632 profit under the other.
- Spreadsheets Fail Quietly: Audits of operational spreadsheets found errors in 94% of the ones studied, and costing models with linked recipes, rates, and yields are exactly where those errors hide.
- Check Co-Product Support Before You Buy: Finance and Operations has native co-product, by-product, and catch weight handling. Business Central has no dedicated by-product feature. AgriERP is available on both.
Introduction
When did you last check what a case of your best-selling product costs to make? If the number comes from a spreadsheet built two years ago, it’s probably wrong. Ingredient prices have moved several times since then, the line runs a different crew, and the pouch film costs more than it did. The P&L still looks acceptable, so nobody goes looking, until a customer asks for a price cut and you can’t say which SKUs can afford it.
Input costs don’t move evenly, which is why old standards mislead. The USDA’s Economic Research Service forecasts 2026 farm-level wheat prices up 18.3% and wholesale beef up 8.5%, and it notes that consumer prices typically lag producer prices. For a manufacturer, that gap shows up in margin first.
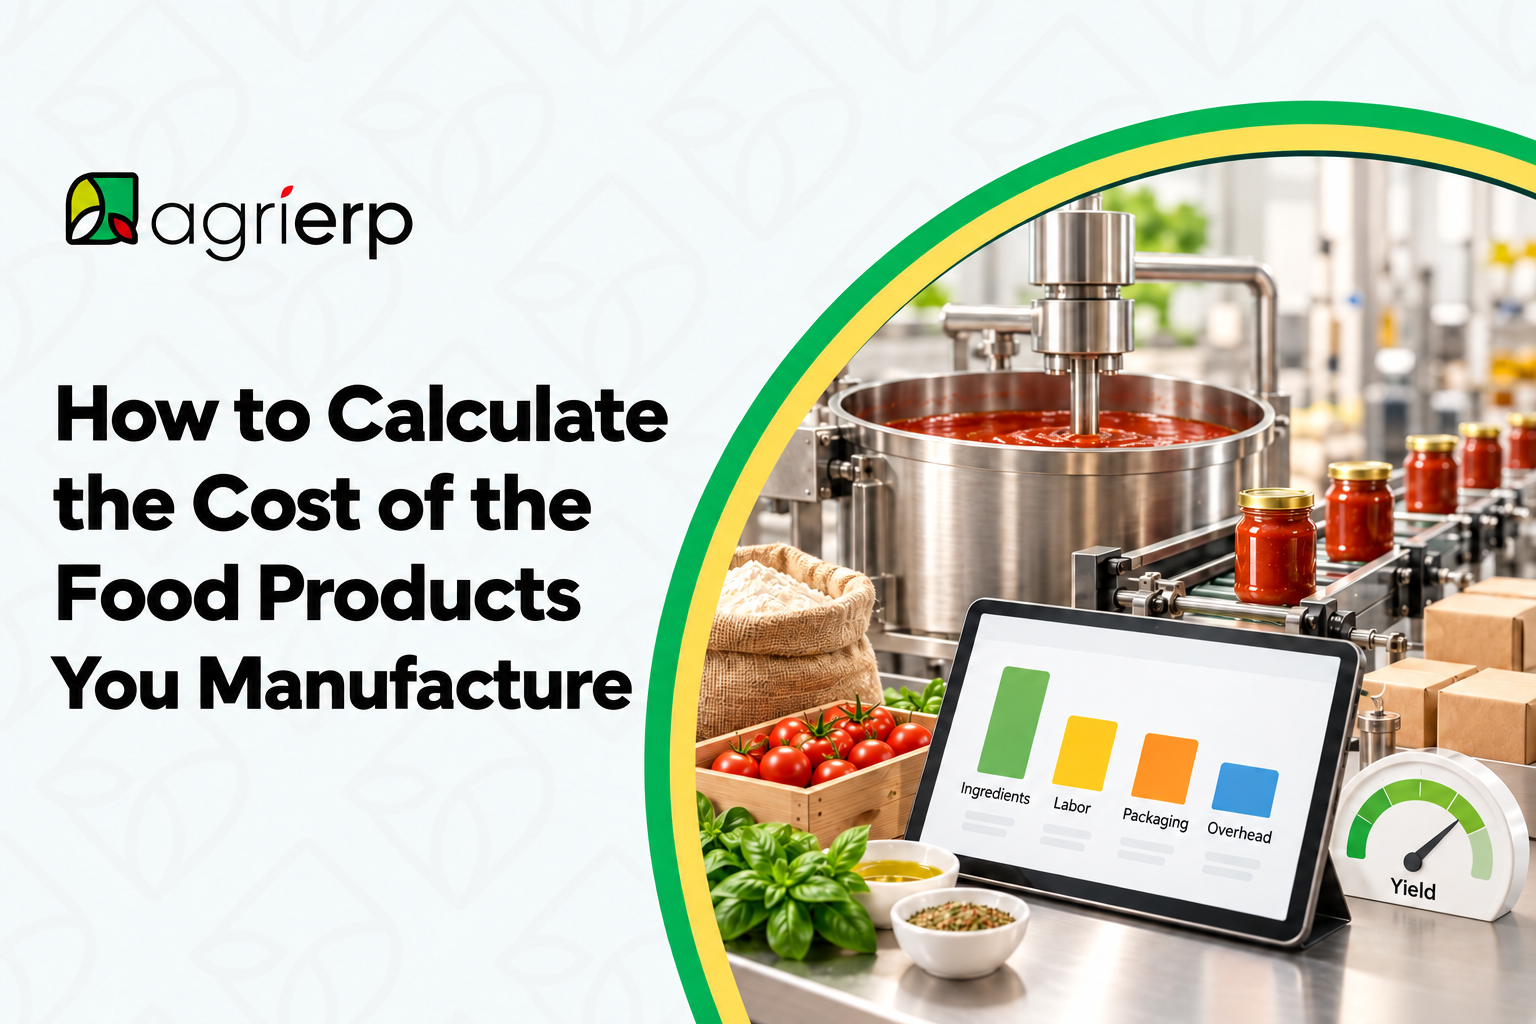
This guide shows how to cost a food product properly. We start with the costing method, then work through raw materials, yield loss, labor and machine time, packaging, overhead, and by-products. After that we cover where spreadsheets stop being enough and what cost accounting software for manufacturing needs to do for a food plant.
Choose a Costing Method Before You Cost Anything
Every product cost depends on the method behind it, and two plants making the same product can report different margins purely because they chose different methods. The common choices are standard, actual (FIFO), or average cost. Business Central, for example, supports five methods: FIFO, LIFO, Average, Standard, and Specific, and you can’t change an item’s method once it has item ledger entries, so the choice is worth making deliberately.
Standard Cost
Standard costing sets a planned cost per unit from the recipe, the routing, and the current rates. Actual costs are then compared with it and the differences are posted as variances. IFRS allows this when the results approximate actual cost: IAS 2 says standard costs must reflect normal levels of materials, labor, efficiency, and capacity use, and be reviewed regularly. That review requirement is where most plants slip. A standard set before a big swing in an ingredient price no longer describes your product.
Actual and Average Cost
Actual costing values each batch at what the inputs really cost. Average costing blends the cost of everything on hand over a period, and in Business Central that period can be a day, week, month, quarter, or accounting period. Both are easier to start with, but neither tells you whether a bad month came from supplier prices or from your own line.
Variances: Where the Margin Went
Variances are what make standard costing useful. Each one isolates a different cause:
- Material price variance: (actual price − standard price) × quantity purchased, calculated at purchase, so it flags supplier changes before the product is made.
- Material usage variance: (actual quantity used − standard quantity) × standard price. In a food plant this is where giveaway, trim, and yield problems show up.
- Labor rate and efficiency variances: rate compares what you paid per hour with the standard, and efficiency compares hours used with hours allowed.
- Overhead variances: spending and efficiency, calculated against a predetermined rate.
Business Central tracks variances by purchase, material, capacity, subcontracted, capacity overhead, and manufacturing overhead, and only for items on Standard costing. Variances settle when a production order is finished and the cost adjustment runs, so a month-end close that skips that step produces margins that look better than they are. We’d choose standard costing for most food plants and review the standards every quarter, because it keeps price effects and yield effects apart.
Raw Materials and Yield Loss: Cost the Usable Product
The recipe is the starting point for raw material cost, and the mistake is costing it from the invoice. A formula that calls for 100 pounds of an ingredient doesn’t cost 100 pounds at the purchase price when some of that ingredient is trimmed, cooked off, or left in the equipment. What you pay for and what ends up in the package are two different weights.
Cost Per Usable Unit
The correction is simple: divide the as-purchased cost by the yield. A foodservice costing example from Penn State’s open textbook shows how large it gets. A 3,750 g leg of lamb at $6.50 per kilogram costs $24.38. After 900 g of trim loss, 500 g of cook loss, and 750 g of bone and trim, 1,600 g is saleable, a yield of about 43%. The cost per usable kilogram is $15.24, which is 2.34 times the purchase price. A manufacturer’s numbers differ, but the arithmetic is identical, and a raw material line that omits it understates cost on every unit sold.
Meat has well-documented ranges. UW-Madison Extension puts dressing percentage at 70 to 75% for hogs, and chilled carcass to retail cuts at 74% for bone-in and 65% for boneless, closely trimmed cuts. Dairy, bakery, and produce lines have their own yield curves, and each one belongs in the product’s cost.
Normal Loss and Abnormal Loss
Not all loss is treated alike. Normal loss is the expected amount that a process always produces, and it belongs in the standard cost. Abnormal loss, such as a batch lost to a wrong machine setup, is charged to expense as incurred and kept out of inventory cost. Both IFRS and US GAAP draw the same line: IAS 2 excludes abnormal amounts of wasted materials, labor, or other production costs from inventory, and FASB’s inventory standard requires abnormal spoilage to be recognized as current-period charges.
The practical consequence is that you need a defined normal yield per product. Without one, a bad day’s scrap gets folded into inventory value and your margin looks healthier than it is until the write-off arrives.
Where Yield Lives in the System
Business Central handles loss in two places. A production BOM carries a Scrap % that adds a fixed percentage of components to the expected consumption, and a routing line carries a scrap factor, which scales the capacity cost of each operation by the accumulated scrap and raises the standard cost of the item. In Finance and Operations, yield is set on the formula version and applies a yield factor to all formula lines when a batch order is created, calculated as actual output divided by theoretical output.
Labor, Machine Time, and Overhead
Once materials are costed, the next question is what the plant spends to turn them into a finished product. Direct labor is usually simple to measure. Machine time and overhead are where costs get spread across products on bases that nobody has questioned in years.
Labor and Machine Time
A routing records how many minutes each operation takes and which work center runs it. In Business Central, a work center’s unit cost is its direct unit cost, plus an indirect cost percentage applied to that rate, plus an absolute overhead rate. The same page shows how runs are timed: setup time is calculated per production order, and run time per produced item. That distinction matters for food. A short run of a specialty flavor carries a full changeover and sanitation setup but only a few cases of output, so its true cost per case is far above the cost of the long run next to it. A single average labor rate per product hides that.
Overhead Absorption
Overhead has to be assigned to products through a predetermined rate. Direct labor hours, direct labor dollars, or machine hours are the usual bases, and machine hours have become more common as direct labor shrinks. For an automated line with a few operators, labor hours as a base will push overhead onto the wrong products. If your refrigeration and line depreciation mostly follow machine time, that’s the base to use.
There’s also a capacity rule. Under IAS 2, fixed overhead is allocated on the plant’s normal capacity, and the unit cost of fixed overhead isn’t raised because production is low. The unallocated portion is expensed in the period. US GAAP follows the same principle, requiring fixed overhead allocation based on the normal capacity of the production facilities. For a seasonal food plant, that means an off-season quarter shouldn’t make each unit look more expensive. The idle-capacity cost belongs on the income statement.
Packaging: Cost It at Every Pack Level
Packaging is a real cost line in food, and a Strategy& analysis puts it at roughly 10 to 20% of a food and beverage product’s price. The same report found glass prices up about 24% and plastic about 35% between June 2020 and June 2023. More recent producer price data shows the pressure hasn’t gone away: FoodNavigator, reporting the BLS August 2026 index, has plastic packaging products up 6.2% and paperboard up 5.1% year over year.
That volatility is why packaging belongs in the BOM at its current item cost instead of a flat per-case figure. Film, trays, labels, cases, and pallet wrap each go in at the pack level where they’re used, so a 12 oz pouch and a 5 lb bag of the same product carry different costs. Packaging also has its own waste: rejects at the filler, film lost at line start, and changeovers. A scrap percentage on the packaging component captures that without inflating the food cost.
One setting catches teams out in Business Central. Low-value items such as labels and wrap are often set up as non-inventory, and those are excluded from a produced item’s cost unless you turn on Include Non-Inventory Items to Produced Items in Manufacturing Setup. If that box is unchecked, your standard cost leaves the packaging out.
By-Products and Co-Products: Allocate Deliberately
Cheese plants make whey, meat plants make trim and fat, mills make bran, and juice plants make pulp. When one process creates several outputs, the joint cost has to be divided among them, and the method you pick changes which product looks profitable.
Iowa State’s open managerial accounting text lists three accepted bases for joint products: the sales value at the split-off point, the net realizable value, or a physical measure such as pounds or gallons. By-products are treated differently. Their net realizable value is either subtracted from the joint cost before allocation, or recorded as other income when sold. IAS 2 takes the same view, measuring by-products at net realizable value and deducting it from the cost of the main product.
Same Plant, Same Profit, Different Winners
The same textbook works through a dairy: $350,000 of joint cost, with whey as a by-product worth $147,000 net, leaving $203,000 to allocate to milk, cheese, and butter. Here’s what each method does to product profit.
| Product | Profit, sales value at split-off | Profit, net realizable value |
|---|---|---|
| Milk | $48,500 | $43,158 |
| Cheese | $44,100 | $30,211 |
| Butter | $(10,600) | $8,632 |
| Total | $82,000 | $82,000 |
The total never changes, but butter swings from a loss to a profit and cheese gives up almost a third of its margin. A pricing or discontinuation decision made on one view would be a different decision on the other. We’d pick one basis for the entire plant, document why, and apply it consistently, which is also what IAS 2 expects when it asks for a rational and consistent allocation.
What the Software Has to Handle
This is the area where ERP systems differ most. Business Central has no dedicated by-product feature, and the usual workaround is to post the by-product as negative consumption, which needs careful setup to cost correctly. Finance and Operations handles it natively. Co-products carry a cost allocation percentage, and total cost allocation calculates the cost as a weighted average between the quantities reported as finished for the formula item and its co-products. By-products can be allocated by None, Percent, Per series, or Per quantity. Planning items let one batch order produce several co-products together, with no production cost assigned to the planning item, since the cost flows to the co-products.
Why Spreadsheets Aren’t Enough
Many food manufacturers start with a spreadsheet, and for one product on one line it works. The trouble starts when the workbook grows to a tab per recipe, each one carrying its own copy of the ingredient prices. A purchasing manager updates whey protein on one tab, the five other recipes that use it keep the old price, and the cost of every one of them is wrong until someone notices. Nothing in the file flags it.
That pattern is well documented. Raymond Panko’s review of spreadsheet audits found errors in 94% of the 85 operational spreadsheets studied, and commercial inspections found cell error rates of 1.2%, 2.2%, and 2.5%. Most of those audits date from the 1990s and early 2000s and none targeted costing models specifically, so read the numbers as a warning about the format. A costing model, with linked recipes, yields, and rates, has more places for a stale cell to hide than most.
There are three other limits that error rates don’t capture:
- No link to production: a spreadsheet standard doesn’t know what the line actually consumed, so it can’t produce a usage variance. Someone has to key in actuals after the fact.
- Version drift: when two analysts hold two copies, the “current” cost depends on who you ask.
- No audit trail: an auditor testing inventory valuation under IAS 2 or US GAAP wants to see how a cost was built and who changed the rate, and a cell with a typed-over formula can’t show that.
What Cost Accounting Software Needs to Do for a Food Plant
Accounting software for food manufacturers has to cost a recipe with yield, apply labor and overhead from the routing, handle outputs that aren’t the main product, and keep that cost tied to a lot. AgriERP is built on Microsoft Dynamics 365 and comes in two versions: AgriERP on Business Central and AgriERP on Dynamics 365, which is built on Finance and Operations. The costing engine underneath is Microsoft’s, so the two versions differ most on by-products and catch weight.
| Requirement | Business Central | Finance and Operations |
|---|---|---|
| Costing methods | FIFO, LIFO, Average, Standard, Specific | FIFO, LIFO, moving average, periodic weighted average, standard |
| Standard cost updates | Standard Cost Worksheet suggests, rolls up, and implements changes through a revaluation journal | One- or two-version standard costs, with pending costs activated on a scheduled date |
| Yield and scrap | BOM scrap percentage and routing scrap factor | Yield factor on the formula version, plus scrap calculations |
| By-products and co-products | No dedicated feature | Native co-products, by-products, cost allocation percentages, and planning items |
| Catch weight | Not covered in Microsoft’s documentation | Dual unit of measure for formula items on batch orders, with weight variances posted to loss and profit accounts |
| Shelf life and traceability | Expiration dates, FEFO picking, and forward and backward lot tracing | Shelf advice, shelf life, and best-before periods, plus batch attributes |
Microsoft Learn documents each row in detail: costing methods, standard cost calculation, standard cost updates in Finance and Operations, catch weight, and item tracking and expiry.
Our view is that AgriERP on Business Central fits processors whose products come from a recipe or pack spec with one main output, such as packed produce. Once you have co-products, catch weight, or batch-based process manufacturing, AgriERP on Dynamics 365 is the safer base. Superior Farms, a lamb processor in Davis, California with two plants, uses AgriERP as the livestock layer on top of Dynamics 365 Finance and Supply Chain Management, with item-level lot, pallet, and license plate tracking.
AgriERP’s contribution sits upstream of the line. Its expense modules for inputs, labor, and machinery report cost by crop, field, or region, and harvest and yield tracking live in the same system the plant costs from, so the raw material cost entering the recipe comes from the same books. Our post on yield management in food manufacturing covers the yield side in more detail.
One limit applies to both versions. In Business Central, item tracking can be used with any costing method, but the cost won’t follow the lot number, only the cost assumption of the method you chose. If you need to know what a specific recalled lot cost to make, plan for that in the design and don’t assume the standard reports will show it.
Rebuild One Product’s Cost to Test Your Margins
You don’t need new software to find out whether your numbers are off. Rebuild the cost of one product from scratch and compare it with what your system says.
- Start with your highest-volume SKU: pull the recipe as it’s actually run, with the weights the line really uses and the yield from the last few batches.
- Reprice every input: use the current purchase cost for ingredients, then add packaging at each pack level, including its scrap.
- Add conversion cost: take routing time at actual line speed, add setup and sanitation per run, and apply overhead on the base you chose.
- Allocate by-product value: deduct or allocate the net realizable value of anything else the batch produces, using one method you can defend.
- Compare with the system cost: the difference is your first variance. If it’s large, the old number has been driving your pricing.
Repeat the exercise for your lowest-margin SKU. If both rebuilds take more than an afternoon, that’s the clearest sign the costing needs to live in a system where the recipe and rates are connected.
Frequently Asked Questions
What’s the difference between standard and actual costing for food products?
Standard costing sets a planned cost per unit from the recipe, routing, and current rates, then posts the differences between planned and actual as variances. Actual costing values each batch at what its inputs really cost. Standard costing is easier to compare across batches, and it separates a price problem from a yield problem, while actual costing shows exactly what a given batch cost.
How often should standard costs be updated?
IAS 2 expects standard costs to be reviewed regularly and revised for current conditions. For most food plants, that means a scheduled review each quarter, plus an unscheduled one after any large move in a major ingredient or packaging price. In Business Central, the Standard Cost Worksheet suggests new costs, rolls them up, and implements them through a revaluation journal.
How do you account for a by-product like whey or trim?
There are two accepted treatments. You can subtract the by-product’s net realizable value from the joint cost before allocating the remainder to the main products, or record the proceeds as other income when you sell it. Pick one, apply it to every by-product in the plant, and keep the reason on file for your auditors.
When should a food manufacturer move off spreadsheets?
The usual triggers are a second production line, the first by-product or co-product, a customer or regulator asking for lot-level records, and an audit that asks how inventory was valued. Any one of them is reason enough to move the recipe and its rates into a system that connects them to production.
Next Step
If your margins don’t match what the books say, we’ll walk through your recipes and by-products and show how they’d cost in AgriERP. Book a free consultation and bring the SKU you trust least.