The ERP Solution for the Year” 2025 in Agtech Breakthrough Awards 2025
Key Takeaways
- Farm equipment downtime during peak season costs far more than the parts and labor. Yield loss from delayed planting or harvest compounds daily, and that cost does not appear on any repair invoice.
- Machinery repair costs are non-linear and accelerate with age. The ASABE repair cost model shows this clearly: what a machine costs to maintain at 3,000 hours is structurally different from what it cost at 1,000.
- Preventive maintenance programs produce measurably lower repair bills. Operations that run scheduled maintenance rather than responding to breakdowns carry roughly 25% lower annual repair costs.
- MRO inventory management, meaning stocking critical wear parts before they are needed, is the difference between a two-hour fix and a two-day wait. Filters, belts, hydraulic seals, and hoses belong on the shelf before planting or harvest starts, not on a purchase order after something breaks.
- An ERP built for agriculture, like AgriERP, centralizes equipment service records, maintenance schedules, and repair cost history so operations can track machinery costs by enterprise and make replacement decisions from data rather than from gut feel.
Introduction
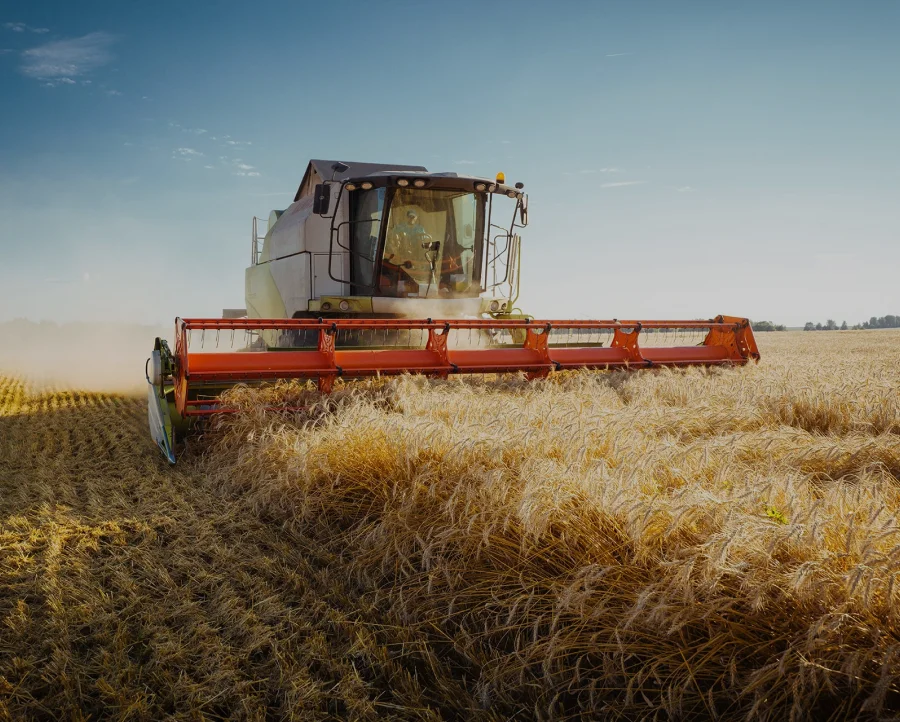
Farm equipment downtime during planting and harvest costs far more than the repair bill. A combine that goes down on day one of harvest costs a few hundred dollars to fix. The real cost is everything that happens. It sits: acres left standing, grain moisture climbing, the dealer who cannot send anyone until Thursday. A weather window that does not wait.
That is how farm equipment downtime works. The repair bill is the smallest part of it. The timing cost is what actually matters, and timing during planting or harvest is not something you can buy back.
The operations that handle this best are not the ones with the newest equipment. They are the ones with a maintenance system and a parts bench.
Farm Equipment Downtime Costs More Than the Repair Bill
Getting a machine back to running is the visible cost. What actually drives the number is everything that happens between the breakdown and the restart.
The Repair Bill Is Only Part of It
Farm machinery repair and parts costs rose 41% between 2020 and 2025, according to Bureau of Labor Statistics data reported by Investigate Midwest. A 2023 Public Interest Research Group study found that farmers lose an average of $3,348 per year to repair downtime and manufacturer restrictions. Those restrictions limit the ability to fix equipment in-house. That figure covers both the direct cost of being down and the indirect cost of not being able to resolve the problem in-house.
Machinery-related costs on central Illinois corn farms rose from $136 per acre in 2021 to $171 per acre in 2024, a 25% increase, according to researchers at the University of Illinois farmdoc program. That figure includes depreciation, fuel, repairs, labor, and interest. Repair cost inflation is one of the primary drivers pushing it higher.
Timing Is What Makes Downtime Expensive
The repair bill is recoverable. Lost time during a planting or harvest window is not.
Research cited by Ag Proud from an Ontario, Canada study found that every day a winter wheat seeding is delayed past the optimum date costs 1.1 bushels per acre in yield. At $7 per bushel, that is $7.70 per acre per day, or $53.90 per acre per week. That figure does not include any quality premium impact. On a 500-acre wheat operation, a week of planting delay runs nearly $27,000 in lost yield. That is before the repair bill is factored in.
Harvest timing carries a similar penalty. ScienceDirect’s review of combine harvester operations notes that corn yield losses increase at 0.5% or more per week once the optimal harvest window has passed. Weather compounds the problem. A two-day breakdown followed by rain can push grain moisture up enough to trigger drying charges or dockage at the elevator. That adds cost on top of yield loss.
The breakdown itself is often smaller than its consequences.
What Farm Machinery Repair Actually Costs Over Time
Repair costs are not a flat annual expense. They follow a curve that accelerates with machine age and accumulated hours. Most budgets underestimate what the later years of a machine’s life will cost.
How the ASABE Repair Cost Model Works
The American Society of Agricultural and Biological Engineers (ASABE) publishes repair cost factors for major equipment types. These run as a percentage of new list price per 100 hours of use. Mississippi State Extension explains the calculation. A two-wheel-drive tractor up to 150 horsepower carries a repair cost factor averaging 0.84% of new list price per 100 hours.
Applied to a 130-horsepower tractor with a $120,000 list price running 400 hours per year, that produces an estimated annual repair cost of $4,032. The key detail is that this factor is a lifetime average. Repair costs in early years run lower than the average; in later years they run well above it. A machine at 8,000 accumulated hours is not spending at the same rate as a machine at 2,000 hours. As Farm Progress notes in its analysis of agricultural custom rates, ASABE formulas are the industry standard for estimating machinery repair expenses. They capture this non-linear pattern: repair costs accelerate with age, not just inflation.
The practical implication: operations that budget repair costs at a flat annual rate will systematically underestimate what their older machines will cost. May hold onto equipment past the economic replacement point without realizing it.
What High-Net-Return Farms Do Differently on Machinery Costs
The Purdue Center for Commercial Agriculture’s December 2025 machinery cost benchmarks show a consistent pattern. High-net-return operations carry lower machinery costs per acre than low-net-return operations of the same size. For 2024, average corn machinery cost was $185 per acre for small farms and $178 per acre for large farms. But the spread between the top and bottom performers within each size category is significant.
The difference is not primarily about having newer equipment. It is about how machinery is used, maintained, and replaced. High-net-return farms tend to run combines over more acres, which reduces per-acre cost. They manage maintenance as a planned expense rather than an unpredictable one. Machinery cost management is one of the highest-impact areas in overall farm efficiency. Machinery is typically one of the largest variable cost categories on a row crop operation.
Stop Reacting, Start Scheduling
The operations that regularly get surprised by repair bills almost always share the same trait: no scheduled maintenance system. The ones that do not get surprised almost always have one. Preventive maintenance is not about doing more work. It is about doing the right work at the right time. That the work is cheap and the machine keeps running.
Operations with structured preventive maintenance programs carry roughly 25% lower annual repair bills than those that respond reactively. That figure comes from the Folio3 AgTech farm equipment maintenance guide. The logic is straightforward: catching a worn belt before harvest costs a few minutes and a few dollars. Replacing the same belt in the field during harvest, with a dealer run or an overnight parts order involved, costs multiples of that.
Pre-Season Servicing
The most important maintenance window in a farm year is the six to eight weeks before peak season begins. This is when every machine that will run during planting or harvest needs a full inspection. Check engine oil and filters, hydraulic fluid and lines, drive belts and chains, electrical connections and sensors, tire pressure and condition, and all lubrication points.
The goal is not just to find problems. It is to replace components that are worn but still running, before they become failures in the field. University of Wisconsin Extension notes that replacing worn drive components before harvest avoids field delays. Dealers may not have stock, and preventive replacement often costs less than one hour of downtime during ideal harvest conditions. A worn seal that costs $40 to replace in the shop costs far more to replace in the field during a narrow weather window.
In-Season Inspection Cadence
Daily checks during planting and harvest are not optional: fluid levels, unusual noises, any warning lights or sensor alerts. A visual inspection of components under stress. Weekly checks catch what daily walkthroughs miss: filter condition, belt tension, bearing temperature. Fasteners that have worked loose under vibration. These checks are short. Their value is in catching degradation before it becomes failure.
A structured maintenance cadence organized by interval (daily, weekly, monthly, seasonal) means no inspection gets skipped. It was assumed someone else had done it. The gap in most farm operations is not that people do not know what to check. It is that checks happen informally, which means they happen inconsistently.
Off-Season Overhaul
The off-season is when the economics of maintenance work most favorably. Labor is available, dealers have parts in stock, and there is no window pressure. This is the time for inspecting and rebuilding components that survive the season but show wear. Address items flagged during in-season checks that were deferred to avoid downtime. Prepare a parts list for the following pre-season.
Operations that use the off-season systematically find fewer surprises at pre-season inspection time. Operations that treat off-season as a rest period for the equipment find the same problems a week before planting begins. Parts are back-ordered and dealer schedules are full.
MRO Inventory Management: The Parts Problem
The repair gets done when the part arrives. For most farm operations, the part arrives after the order is placed, after the supplier confirms availability. After the shipping or pickup is arranged. That sequence can take hours or days. During planting or harvest, every hour in that sequence is a direct loss.
MRO inventory management, the practice of stocking maintenance, repair. Operations supplies in advance rather than ordering them on demand, addresses this directly.
What MRO Inventory Means on a Farm Operation
As NetSuite’s MRO inventory guide defines it, MRO inventory covers the parts, consumables, tools. Supplies that keep an operation running without being part of the product itself. On a farm, that means filters, belts, hydraulic hoses and seals, lubricants, fuses, sensors. The specific wear components for each piece of equipment in the fleet.
MRO inventory does not generate revenue on its own. That is exactly why it tends to get undermanaged. It sits on a shelf and looks like tied-up capital until the morning something breaks and the part is not there. Research across industries finds that 42% of business owners report their parts and consumables tracking needs improvement. On a farm, the consequences of that gap are seasonal and acute.
Criticality-Based Stocking: Which Parts to Always Have on Hand
Not all parts deserve the same inventory treatment. Criticality-based stocking means categorizing components by two factors: how likely they are to fail. What happens to the operation when they do.
Critical wear parts (filters, belts, hydraulic seals, drive chains, hoses) fail regularly under normal operating conditions and stop production immediately when they do. These should be on hand in sufficient quantity to cover the full peak season without a reorder. Non-critical parts that are readily available from a local dealer or within same-day delivery can be ordered as needed without carrying inventory.
Start with a list of every wear item that has caused unexpected downtime in the last three seasons. Add the manufacturer’s recommended replacement intervals for high-stress components. That becomes the minimum stocking inventory. That list becomes the minimum stocking inventory going into each season.
Pre-Season Stocking vs Emergency Ordering
The cost difference between ordering parts in February and ordering the same parts in June during a breakdown is not just a price difference. It is a time difference. Pre-season orders arrive on a normal schedule, at standard pricing, with full dealer attention. Emergency orders during harvest compete with every other operation in the region that is running, breaking down, and calling the same dealer.
Stocking critical parts before the season starts means a breakdown that would otherwise be a two-day delay becomes a two-hour repair. The capital cost of holding that inventory is real but small relative to even a single day of downtime during a peak window.
The Records Problem
A maintenance system is only as useful as the records it produces. Without documentation, an operation cannot know which machines are approaching the expensive part of their repair cost curve. It cannot allocate repair costs to the field or enterprise where the equipment was used. It also has no defensible case for replacing a machine rather than repairing it one more time.
Most farm maintenance records are a combination of dealer invoices, handwritten log entries. Institutional memory held by whoever has been running the equipment longest. That is enough to keep things running day to day. It is not enough to make good replacement decisions or to compare the true per-acre machinery cost across different operations or seasons.
For tracking the true cost of farm machinery across enterprises, the connection between operational records and financial records matters as much as the maintenance itself. A repair cost logged to a whole-farm expense account, without being tied to the field or crop it served, does not feed into an accurate per-acre cost of production. The machinery cost section of the farm cost of production framework requires records that show. And how equipment went, not just what it cost to fix.
How a Connected System Keeps Equipment Running
Maintenance tracking on paper or in a general-purpose spreadsheet works until the operation grows past one person’s ability to hold everything in their head. At that point, service intervals get missed, repair history is spread across filing cabinets and phone photos. The question “when did we last service that planter?” takes an afternoon to answer.
A connected farm management system centralizes equipment records (service history, upcoming maintenance intervals, repair costs. Hours logged by machine) so the information is accessible, searchable, and current. When a piece of equipment approaches a scheduled service interval, the system flags it. When a repair is completed, the cost is recorded against the machine and the enterprise it serves. Over time, that history produces the data needed to compare the annualized cost of running an aging machine against the cost of replacing it.
AgriERP’s asset and equipment management capabilities connect operational records to financial reporting. Machinery costs flow to per-acre and per-enterprise tracking rather than sitting as undifferentiated farm expenses. For operations evaluating whether this infrastructure makes sense, the farm management software overview covers how the category works and where different operation types fit.
AgriERP makes sense for medium-to-large operations running multiple machines across multiple enterprises. The coordination cost of manual maintenance tracking has become a real source of missed service intervals and accumulated repair costs. It is not the right tool for a two-tractor operation. One person knows every machine personally and tracks service in a notebook. The overhead of a full ERP implementation would not pay for itself there.
For operations where equipment management has outgrown the systems currently in place, request a demo to see how AgriERP handles maintenance scheduling, asset tracking, and machinery cost allocation in practice.
Ready to Get Ahead of the Next Breakdown?
AgriERP centralizes equipment service history, maintenance schedules. Repair costs by machine and enterprise, so you know what is due before something breaks and what it is costing you per acre when it does.
Book a demo with AgriERP to see how equipment management works inside a connected agriculture platform.
Frequently Asked Questions
What does farm equipment downtime actually cost per day during harvest?
The cost depends on the crop, the operation size, and the timing within the harvest window. For a combine harvesting 100 acres per day that is down for two days, the direct loss is 200 acres unharvested during that period. If rain follows, grain moisture rises and dockage costs at the elevator increase on top of the yield impact. For context, research cited by Ag Proud from an Ontario study found that a single day of delayed planting for winter wheat costs 1.1 bushels per acre in yield loss, worth $7.70 per acre at $7 per bushel. ScienceDirect’s review of corn harvest research puts yield loss from delayed harvesting at 0.5% or more per week past the optimal window. These figures vary by crop, region, and growing conditions. The consistent finding is that the yield cost of downtime during a narrow seasonal window significantly exceeds the repair cost.
How do you calculate expected annual repair costs for farm machinery?
The standard method uses ASABE (American Society of Agricultural and Biological Engineers) repair cost factors. Express expected repair costs as a percentage of the machine’s original list price per 100 hours of use. Mississippi State Extension applies this to a 130-horsepower two-wheel-drive tractor with a $120,000 list price running 400 hours per year. At 0.84% per 100 hours, 400 hours of use against a $120,000 list price gives approximately $4,032 in expected annual repair costs. The important qualifier is that ASABE factors are lifetime averages. Early years cost less than the average; later years cost more. Repair costs accelerate non-linearly with accumulated hours. Machines in the 8,000-to-12,000-hour range carry repair costs well above what the average factor suggests.
What is MRO inventory in agriculture?
MRO stands for maintenance, repair, and operations. MRO inventory is the stock of parts, consumables, tools. Supplies an operation keeps on hand to maintain and repair its equipment: not the inputs that go into the crop itself. The items that keep the machinery running. On a farm, this includes filters, drive belts, hydraulic seals and hoses, lubricants, fuses, sensors. Wear components specific to each machine in the fleet. The defining characteristic of MRO inventory is that it does not generate revenue on its own. Is why it tends to get undermanaged, until a breakdown makes the gap visible.
What should be on a farm equipment pre-season maintenance checklist?
Pre-season servicing should cover every machine that will run during planting or harvest. Core inspection points include engine oil and filter condition, hydraulic fluid level and line integrity, drive belts and chains for wear and tension, all lubrication points, electrical connections and sensor function, tire pressure and tread condition. The calibration of precision components such as planter meters, sprayer nozzles, and yield monitors. Pre-season is also the time to replace components that are worn but still running. Left in place, they are likely to fail during the season. Worn components caught in February cost a fraction of what they cost to replace in the field during a three-day planting window.
How do you decide whether to repair or replace aging farm equipment?
The practical framework compares the annualized cost of keeping the machine running against the annualized cost of replacing it. Key inputs are the machine’s current market value, expected remaining useful life, and annual repair costs based on recent history and the ASABE curve for accumulated hours. Factor in the downtime risk that rises as the machine ages. A machine at 10,000 hours that cost $200,000 new and now generates $15,000 per year in repairs is a different economic case. Compare that to the same machine at 5,000 hours generating $5,000 per year in repairs. The problem is that most operations do not have the repair history organized in a way that makes this calculation straightforward. Operations without detailed service records typically underestimate what their older machines are costing. That leads to holding equipment past the economic replacement point.
How does farm management software help reduce equipment downtime?
Farm management software reduces downtime in two ways: by tracking service intervals so maintenance happens on schedule rather than in response to failure. By creating a searchable repair history that surfaces patterns before they become crises. A machine that has needed the same repair three times in two seasons is signaling something; without a log, that pattern is invisible. Connected software also ties repair costs to the specific enterprise and field where the equipment went. Feeds accurate machinery cost data into per-acre cost of production calculations rather than pooling all repair costs as undifferentiated farm overhead.