Data Analytics Solution of the Year” 2026 in Agtech Breakthrough Awards 2026


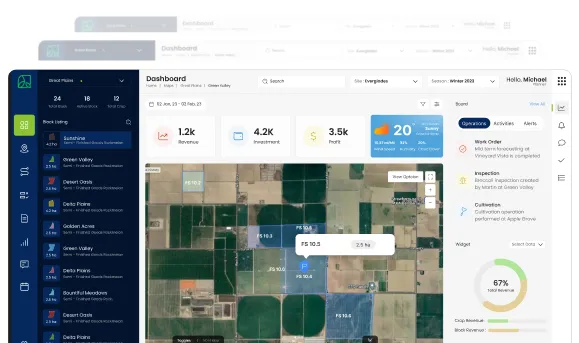
Everything covered so far in this documentation – the crop plan, the work orders, the production runs, the workforce, the equipment, the chemical applications – generates a constant stream of operational data. Monitor Farms is the chapter of the AgriERP story where that data turns into something the team can actually act on: a live, accurate, drillable picture of what is happening across the entire operation, right now.
Monitor Farms is built on AgriERP’s Analytics Layer (the reporting platform and unified data foundation covered earlier in the documentation), and on the live data feeds coming through the Integration Layer from the field, the packhouse, and the office. It is not a separate product; it is what those layers deliver when an agribusiness needs to know what is happening across the farm without phone calls, drives, or weekly reports.
What this section covers
- What real-time visibility actually means: the difference between a live operating picture and a stale weekly summary, and why that difference matters.
- The standard Monitor Farms views: the dashboards every agribusiness uses to run the day, the week, and the season.
- Alerts and exception handling: the things the system surfaces automatically so the team is not staring at dashboards all day.
- Mobile and remote use: how the same visibility follows the owner or operations director out of the office and onto the road, the farm, or another country.
1. What real-time farm visibility actually means
In one line Real-time visibility means looking at the operation as it is now, not as it was at the end of last week, and being able to drill from a headline number all the way down to a single work order in the field, in seconds.
How most agribusinesses see their operations today
In most agribusinesses, the management view of the operation is reconstructed weekly. Supervisors send updates. The office consolidates spreadsheets. By Monday morning, leadership has a report on what happened last week. By Tuesday, the picture is out of date. By Friday, the picture is irrelevant. Decisions get made on memory, instinct, and the most recent phone call from a manager.
That model worked when farms were small, decisions were slow, and a single owner walked every block weekly. It does not work for operations across multiple farms, multiple crops, hundreds of workers, and a packhouse running into the night.
What AgriERP delivers instead
Because every part of AgriERP captures data as work happens, in the field on the mobile app, in the packhouse on the production line, at the weighbridge, in the workshop, in the office, the system always has the current state. The Monitor Farms views read directly from the data foundation covered in the Analytics Layer section, with the freshness varying by source:
| Capability | What it means in practice |
|---|---|
| Field work in progress | Updated as workers tap start, capture inputs, and tap complete on the mobile app. Visible within seconds of the action in the field. |
| Packhouse production | Updated as cartons are reported as finished off the line. Visible within seconds of the carton coming off the production order. |
| Inventory movements | Updated as inputs are deducted, harvest is received, and finished product is added. Visible within seconds of the transaction. |
| Sensor and equipment readings | Updated as the sensor sends, through the Integration Layer. Visible within seconds of the reading. |
| Financial figures | Updated as transactions post. Cost numbers refresh continuously, with no end-of-day or month-end consolidation needed. |
| External integrations (banks, buyers, market data) | Updated on each scheduled or event-driven integration cycle, typically within minutes of the source system. |
Why this mattersReal-time visibility is not about staring at numbers. It is about being able to ask the operation a question, and having the answer be true now, not true last Friday. When the question is “are we on track to deliver the retailer’s contract this week?” or “do we have enough sprayer capacity to cover the weather window before Friday?” the value of an answer that is current is the difference between catching a problem and being told about it after the fact.
2. The standard Monitor Farms views
AgriERP ships with a library of standard dashboards built for the audiences that actually run agribusinesses: owners, operations directors, packhouse managers, farm managers, finance directors, and grower-program leads. Each is built on the reporting platform, against the unified data foundation, with agriculture-specific data models on top.
Operations dashboards (today and this week)
Operations dashboards answer the question “what is happening right now and what needs my attention today or this week?”
| Capability | What it means in practice |
|---|---|
| Live work order status | Every work order in progress, scheduled for today, or scheduled for this week, by farm, by block, by crew. Status colours surface anything overdue or at risk. |
| Crew and equipment utilisation | Who is on which block, doing which activity, right now. Equipment utilisation across the fleet. Idle capacity highlighted. |
| Daily harvest tracker | Tonnes harvested today, by block, by variety, against today’s target. Cumulative for the harvest window. |
| Packhouse line status | Active production orders, throughput per hour, WIP balance, pack-out percentage by grade, by line. |
| Inventory at a glance | Inputs on hand vs. demand for the next 7 days. Finished product on hand vs. open orders. Alerts on anything short. |
| Weather and field conditions | Current weather and 7-day forecast for each farm, with spray-window and harvest-window flags. |
Performance dashboards (this season)
Performance dashboards answer the question “how is the season going, and where do we stand against plan?”
| Capability | What it means in practice |
|---|---|
| Yield vs. plan, by block and crop | Actual harvest vs. planned yield, by block, by crop, by variety. Variances surfaced as the season progresses. |
| Cost per block, crop, and season | Real-time cost-per-block and cost-per-acre, against budget. Drill from the season total to individual cost lines and work orders. |
| Budget vs. actual | The original season budget alongside actual spend. Forecast end-of-season position, given current run rate. |
| Pack-out and quality trends | Percentage of harvest packed Class 1, Class 2, juice-grade, waste, over the season. Quality patterns by block, variety, and growing condition. |
| Contract fulfilment status | Each signed sales agreement, with commitment, delivered to date, remaining, and projected fulfilment. Risks surfaced. |
| Grower program performance | For grower programs: deliveries from each grower vs. their contract, with quality and on-time performance metrics. |
Financial dashboards (cash and books)
Financial dashboards answer the question “where is the money, and are we making it?”
| Capability | What it means in practice |
|---|---|
| Cash position and projections | Current cash on hand, committed cash out, projected receipts. Weekly and monthly cash flow forecast. |
| Revenue vs. forecast | Revenue this season vs. the forecast and prior year, by crop, by buyer, by market. |
| Margin by crop and block | True margin per kilogram per block, per crop, per season, with the cost layers underneath. The question every owner wants answered. |
| Working capital | Inventory value (raw, WIP, finished), receivables, payables, and the working capital cycle. Where cash is currently locked up. |
| Capital and depreciation | Capital assets, depreciation, capex spend vs. budget, asset utilisation. |
Compliance and audit dashboards
Compliance dashboards answer the question “are we covered, certified, and ready for the next audit?”
- Certification status: every farm, block, and grower with their current certification status and renewal dates. Anything approaching expiry surfaced.
- Spray and chemical compliance: every application, in the season window, with rate, conditions, worker, and certification status, in audit-ready format.
- Re-entry and pre-harvest interval tracking: blocks currently inside any active interval, with the time remaining until the interval expires.
- Worker certifications: every worker’s current certifications, with renewal dates and training due. Anything overdue, surfaced.
- Traceability readiness: for every active finished-product lot, the chain back to block, harvest crew, and inputs. One click to a full traceability report.
3. Alerts and exception handling
In one lineThe system watches for the things that need attention and surfaces them to the right person at the right time, so the team does not have to live on dashboards.
Why alerts matter more than dashboards
Dashboards are powerful, but only useful when someone is looking. The reality of running a farm is that no one is staring at a dashboard at 2pm on a Wednesday when something starts to go wrong. The system has to surface problems by reaching out, not by waiting to be checked.
AgriERP uses the standard alerts and subscriptions features of the reporting platform to push relevant information to relevant people, by email or notification, scheduled or event-driven, automatically.
Types of alerts AgriERP supports out of the box
| Capability | What it means in practice |
|---|---|
| Operational alerts | Work order overdue. Crew off schedule. Equipment fault. Packing line stopped. Harvest behind plan. Surface within minutes of detection. |
| Compliance alerts | Certification expiring soon. Re-entry interval violation attempted. Chemical assignment blocked by buyer rules. Spray-record gap detected. |
| Financial alerts | Budget variance crosses threshold (“alert me if cost-per-acre on Block 22 goes 10% over budget”). Cash position falls below threshold. Receivables aging past trigger. |
| Inventory alerts | Input shortage projected (“running out of fungicide before the spray window”). Cold storage approaching capacity. Finished inventory matched against open orders. |
| Weather and condition alerts | Spray window opening or closing. Frost risk forecast. Excessive heat warning. Rain forecast within pre-harvest interval. |
| Grower and contract alerts | Grower behind contract. Buyer order at risk. Contract approaching expiry. Quality issue raised. |
| Scheduled summaries | End-of-day operational summary. Weekly financial summary. Monthly executive summary. Delivered by email to the audience that needs them, automatically. |
How alerts are configured
- Standard alert library: AgriERP ships with a library of standard alerts for the most common operational, financial, and compliance scenarios. They turn on with a few configuration choices, not a coding project.
- Custom alerts: any metric in the data foundation can be alerted on. The user sets a threshold and a recipient list; the system handles delivery.
- Routing to the right person: alerts can be routed to specific roles, specific people, or specific groups. A spray-window opening might go to the supervisor; a cash threshold might go to the CFO.
- Delivery channels: email, mobile app notification, or both. Recipients choose how they want to be reached.
- Snooze and acknowledge: alerts can be acknowledged, snoozed, or escalated. Repeat alerts on the same condition do not pile up indefinitely.
4. Mobile and remote use
In one line The same Monitor Farms view that runs in the office runs on the owner’s or operations director’s phone, with mobile-optimised layouts, so the visibility follows them out the door.
Why this matters
Owners and operations directors do not sit at desks. They are on farms, in trucks, in trade meetings, on planes. The visibility that lives only in the office is visibility that goes dark for half the working day. AgriERP delivers the same Monitor Farms dashboards through the mobile app for the reporting platform, with layouts that work on a phone screen, so the operational picture is available wherever the user is.
What mobile delivers
| Capability | What it means in practice |
|---|---|
| Same data, same governance | Mobile views read from the same data foundation as the desktop dashboards. There is no separate mobile data set, no parallel reality. |
| Mobile-optimised layouts | Layouts are adapted for portrait viewing on a phone, with the most critical metrics surfaced first and detail accessible through drill-down. |
| Push notifications for alerts | Alerts arrive on the device, whether or not the user is in the app. The owner does not need to be looking to know something needs attention. |
| Offline access to recent data | Last-known dashboards are available when the device is offline, with a clear indicator of how recent the data is. |
| Secure access | Sign-in uses the enterprise identity service. Lost or stolen devices can be revoked centrally. Row-Level Security applies just as it does on the desktop. |
Who uses it most
- Owners: the morning summary on the phone, between meetings, on the road. Real numbers, current state, no “I’ll check when I get back to the office.”
- Operations directors: live awareness of what is happening across multiple farms, in the truck between sites, in the field at one of them.
- Farm managers: the daily operational view of their farm, on the phone, while walking blocks.
- Finance directors and CFOs: cash and revenue dashboards on demand, with the same numbers as the desktop. Confidence in board meetings and bank conversations.
- Sales and grower-program leads: contract fulfilment status at a glance, when meeting with a buyer or a grower in person.
5. Monitor Farms in action
The clearest way to understand what Monitor Farms delivers is to look at a real. The example below shows the same operation, from four different perspectives, all in the same system, all using the same live data.
One Wednesday morning, four perspectivesIt is 7:30am on a Wednesday in March. Across the business, four different people open Monitor Farms.The owner, on a phone at home: season-to-date margin per crop, cash on hand, this week’s revenue forecast, this week’s harvest vs. plan. Two minutes, while making coffee, with the same numbers the finance director will see.The operations director, in a truck en route to Farm 2: live work order status across all farms. Two work orders flagged overdue on Farm 3; an alert came in 20 minutes ago. He calls the supervisor en route, problem solved before reaching the farm.The packhouse manager, in the office overlooking the line: the live production view: today’s production orders, current pack-out percentage, throughput per hour, WIP balance, finished cartons awaiting allocation. She sees pack-out on the early run is below target; she investigates and finds a sorter calibration issue.The finance director, in a board prep meeting: real-time cash position, season-to-date revenue, cost-per-block by crop, budget vs. actual variance. He pulls up the dashboard on the screen; the board asks a question about a specific block, he drills down, shows the answer in the same view.Four people. One operating reality. Four different decisions, all made on the same current data, before 9 am.
In summary
Monitor Farms is what AgriERP delivers when the rest of the system is doing its job. Because every block, work order, production run, worker hour, and chemical application is captured as it happens, the system always has a current picture. The Monitor Farms views, built on the reporting platform and the unified data foundation, turn that picture into the dashboards, drill-downs, alerts, and mobile views that the team uses to run the business.
Real-time visibility is not a luxury; it is what separates an agribusiness that responds in hours from one that responds in weeks. And because every level of the operation, owner, operations director, packhouse manager, finance director, farm manager, looks at the same live data, conversations across the business are about what to do, not about whose numbers are right.