Data Analytics Solution of the Year” 2026 in Agtech Breakthrough Awards 2026


Most agricultural work happens outdoors, across distances, on land that has structure. Blocks have boundaries. Equipment moves between locations. Workers travel between sites. Harvest crews need to find the next block. Field officers need to find specific growers’ farms. A list-based view of work, in many situations, is the wrong shape. A map view, in those situations, is the right shape.
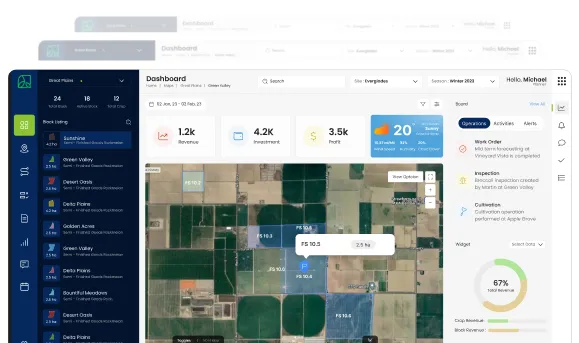
The Map View on the AgriERP mobile app is the spatial layer of the user experience. Where everything is. How to get there. What is happening across the property in real time. This document describes how the map view works on the mobile app: what it shows, how users interact with it, and how GPS data is captured throughout the day.
1. What the map shows
The standard map layers
| Capability | What it means in practice |
|---|---|
| Farm and block boundaries | The polygonal outlines of every farm and every block in the user’s area. Drawn from the Land & Buildings registry. Color-coded by crop, by season, or by status depending on what the user needs. |
| Buildings and facilities | Warehouses, packing sheds, cold stores, offices, fuel depots, marked at their actual locations with type icons. |
| Infrastructure | Irrigation lines, roads and tracks, gates, water sources. Where the business has mapped them, they show on the map. |
| Equipment positions | Where telematics or GPS-equipped equipment is being tracked, current positions show on the map in real time. Equipment in motion shows its direction. |
| Active work orders | Each open work order shows at its block, with an icon for the activity type (spray, harvest, prune, inspect). |
| Workers and crews | Where workers are clocked in with GPS, their position is reflected on the map. Useful for supervisors managing crews in motion. |
| Scouting points and incidents | Pest sightings, disease spots, equipment faults reported during field work appear at the location where they were captured. |
| Grower farms | For grower programs, the registered farms of each grower in the program, with name and program status. |
Map base styles
- Standard map: the default base layer, showing roads, names, and general geography. Useful for navigation.
- Satellite imagery: high-resolution satellite view, showing the actual visual state of the farms. Useful for verifying block boundaries match the visible planted area, and for spotting visible issues from the imagery.
- Hybrid: satellite imagery with overlaid labels and boundaries. The most popular default for field users.
- Terrain: elevation and contour information, useful in hilly or terraced operations where elevation affects planning.
- Custom overlays: where the business has mapped specific overlays (soil zones, drainage zones, microclimate zones), these can be toggled on.
2. Field tracking and GPS capture
Where GPS data is captured
- At clock-in: the worker’s location when they start the day, verifying they are at the right farm or work site.
- At work-order start: the location where work began, verifying the work is happening on the right block.
- At bin scans: every bin or pallet scan in harvest and packing captures the location, building a spatial record of where each container was filled or processed.
- At scouting observations: when a pest, disease, or quality observation is logged, the location is captured automatically. The observation is mappable for trend analysis.
- At incident reports: safety incidents, equipment faults, and other reportable events capture their location, supporting both immediate response and pattern analysis.
- At clock-out: the final location of the day. Combined with the start, useful for verifying full-day attendance patterns.
- At spray and treatment application: for spray work, GPS data can be captured continuously or at intervals, building a track of where the application actually went. Useful for compliance and effectiveness review.
How GPS data is used
| Capability | What it means in practice |
|---|---|
| Verification | Verifying that work happened where it was supposed to happen. A spray work order on Block 14, where the GPS captures show the actual application was on Block 12, surfaces a discrepancy worth investigating. |
| Compliance and audit | For certified or regulated work (organic certification, residue compliance, spray-record requirements), GPS-verified work is more defensible in audit than memory-based work. |
| Productivity analysis | How much area did the crew actually cover? How fast did they move through the block? GPS data adds objectivity to productivity reporting. |
| Pattern detection | Plotting pest and disease observations on the map reveals spatial patterns: prevailing-wind pest pressure, drainage-related disease, equipment damage on specific routes. |
| Route optimization | Where workers move between many blocks or many grower farms in a day, GPS-tracked patterns inform better routing, saving time and fuel. |
| Safety and welfare | In emergencies, knowing where workers are matters. Supervisors can locate their crew quickly when needed. |
3. Interacting with the map
Map interactions
- Pan and zoom: standard touch gestures: drag to pan, pinch to zoom. The map starts centred on the user’s current location by default.
- Tap a block: tapping a block boundary opens its detail card: crop, variety, area, current work orders, recent observations.
- Tap a work order icon: the work order’s detail surfaces, with the option to start or open the work order directly.
- Tap an equipment marker: equipment detail surfaces: asset code, current operator, current work order, status. Useful for finding the nearest tractor or sprayer.
- Layer toggle: a layer control lets the user turn on and off the layers visible: just blocks, just work orders, just equipment, or any combination. Reduces visual clutter to what the user needs at the moment.
- Filter by attribute: filter the map by crop, by status, by assigned crew, by certification, by program. The map redraws to show only what matches.
- Search: search for a specific block, a specific grower, a specific work order. The map zooms and centres on the result.
Navigation and directions
- Get directions to a block: for users who need to drive or walk to a specific work location, the map can launch device navigation with the destination set. The user gets turn-by-turn directions to the block.
- Route to a sequence of work: for users with multiple blocks or farms to visit, an optimised route through the visit list. Useful for field officers and agronomists with full days of visits.
- Offline navigation: for areas with limited connectivity, map tiles can be pre-cached for offline use. Workers can navigate to and within their work areas without signal.
4. Mapping specific work scenarios
Block boundary capture
- Walk-the-boundary capture: to map a new block, the user walks its boundary while the app captures the GPS track. The closed polygon becomes the block boundary in the system.
- Manual digitisation: where walking the boundary is impractical, the user can draw the boundary on the map using satellite imagery as the reference. The drawn polygon is captured as the block boundary.
- Area calculation: as the boundary is captured, area is calculated. Replaces the rough estimates that were the norm before mapping.
- Block updates: where a block is reshaped (extension, removal of a section, merging with a neighbour), the boundary can be re-captured. Version history is preserved.
Scouting walks
- Recording the walk: the scout walks through a block, logging observations at each point. The app captures the walk path and the location of each observation.
- Spatial visualisation: the observations plotted on the map show patterns: pest pressure concentrated on the windward edge, disease spreading from a specific entry point.
- Repeat visits: subsequent scouts of the same block can compare against previous walks. Spreading patterns are visible.
- Triggering response: an observation can be escalated immediately to a work order: “Spray Block 14 for aphid; observation logged here.” The work order inherits the location and the observation history.
Spray path recording
- Continuous GPS during spray: during a spray work order, the app or equipment telematics records the path of application. The track is captured against the work order.
- Coverage verification: comparing the captured path against the block boundary shows whether the application covered the block fully or missed sections. Visible to the supervisor and the agronomist.
- Buffer zone compliance: where regulations require buffer zones (water bodies, neighbouring properties, sensitive areas), the captured path can be checked against the buffer rules.
- Compliance evidence: for certified-organic, residue-managed, or otherwise-regulated programs, the captured spray path is hard evidence for audit.
Grower farm verification
- Field-officer visits: during onboarding and verification visits, the field officer pins the location of the grower’s farm with GPS. Subsequent visits can use the pin for navigation.
- Block mapping for growers: for grower programs, the grower’s individual blocks are mapped the same way as the business’s own. Useful for program-wide spatial analysis.
- Suspected duplication checks: where two growers claim overlapping or adjacent areas, the spatial data surfaces the conflict for resolution.
- Program coverage view: across hundreds of grower farms, the map view shows program density and coverage at a glance. Useful for program managers planning expansion or resource allocation.
Why the map mattersAgricultural operations are inherently spatial. Pretending otherwise, treating blocks as rows in a table and farms as text-addressed records, hides patterns that the eye sees instantly on a map. Pest pressure has shapes. Yield differences have shapes. Equipment wear, water issues, and crew patterns all have shapes. The map view brings them into view.
In summary
The Map View on the AgriERP mobile app is the spatial layer of the user experience. It shows farms, blocks, infrastructure, equipment, work orders, and people, in real time, layered for clarity, on a base map of the user’s choice. It captures GPS data throughout the day to verify work, support compliance, and feed pattern analysis. Specific workflows, block boundary capture, scouting walks, spray path recording, grower farm verification, are supported directly on the map.
Combined with the other mobile-app capabilities, the map turns a list-based interface into a spatial one, matching the actual shape of agricultural work.