Data Analytics Solution of the Year” 2026 in Agtech Breakthrough Awards 2026


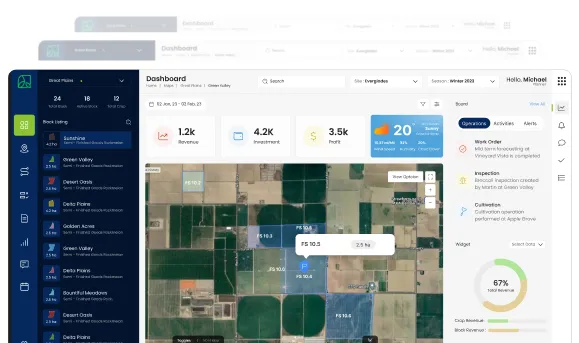
Every part of AgriERP we have covered so far creates data. The Farm Web App produces work plans. The Mobile App captures activity. The Core ERP Layer records cost and inventory. The Grower Portal logs contracts and deliveries. The Integration Layer pulls in sensor readings, weather feeds, and bank confirmations. By the end of any single day, a working agribusiness produces thousands of data points.
None of that data is useful on its own. It only becomes useful when someone, an owner, an operations manager, a finance director, can look at it and see what is happening, what is going right, and what is going wrong. That is the job of the Analytics Layer.
The Analytics Layer is built on two integrated capabilities: a business analytics platform for reporting and visualisation, and a unified data foundation underneath that brings all of the data together. AgriERP shapes both of them around the realities of agriculture, so the dashboards, reports, and insights that come out are not generic; they are about your crops, your blocks, your seasons, and your growers.
What this section covers
The Analytics Layer is built around two integrated capabilities:
- Reporting and visualisation: the layer where the agribusiness actually sees and explores its data, through dashboards, reports, and drill-down views.
- Unified data foundation: the platform underneath that brings all of the data together, prepares it, governs it, and makes it ready for analysis.
Most of what makes both possible is provided by an enterprise analytics platform. The agriculture-specific shaping is what AgriERP layers on top, the metrics, models, and reports built for farms instead of factories.
The Enterprise Foundation
Before going into the reporting and data layers specifically, it helps to understand what each is and how they fit together. AgriERP’s Analytics Layer is built on a mature analytics platform with over a decade of investment in business intelligence and data engineering.
Reporting and Visualisation
AgriERP’s reporting capability is a business analytics platform that helps users turn data into actionable insights. It is the visual front-end of the analytics stack, the place where charts, dashboards, and reports are built and consumed. There are three main components, all of which AgriERP makes use of.
| Component | What it provides |
|---|---|
| Desktop authoring | A desktop application used by report designers to model data, create visuals, and build polished dashboards. This is where the AgriERP standard report library is built and customised. |
| Cloud service | The cloud-based platform where reports are published, shared, scheduled to refresh, and accessed by business users. This is where most of your team will spend time, in the browser, looking at live dashboards. |
| Mobile app | The mobile app that lets owners and operations managers view dashboards, drill down, and receive alerts on their phone. Layouts are optimised for portrait viewing on small screens. |
Unified data foundation
Sitting underneath the reporting layer is a unified analytics platform. It is an all-in-one analytics solution that covers everything from data movement, to data science, to real-time analytics, to business intelligence, all on a single cloud platform. The reporting layer is one of the core workloads inside it.
The most important thing about this foundation, from your point of view, is what it removes. Traditionally, organisations had a data warehouse for structured business data, a data lake for big and unstructured data, and separate tools to move data between them. The unified foundation eliminates that split.
| Capability | What it provides to AgriERP |
|---|---|
| A single, unified data lake | A unified, logical data lake that sits at the centre of the platform. All data, structured or unstructured, lives here in one place. There is no copying, no separate warehouse and lake to keep in sync. |
| Lakehouse workload | A workload that combines the scalability of a data lake with the querying power of a data warehouse. AgriERP uses lakehouses to store and analyse the high-volume operational data flowing in from the Mobile App, sensors, and integrations. |
| Data integration and pipelines | Tools for moving and transforming data at scale. Pipelines pull data in from the Core ERP Layer, the Integration Layer, and external sources, on schedule or in real time. |
| Reporting inside the data foundation | Reports built in the reporting layer can read directly from the unified data lake, with no data duplication. Updates in operational data appear in the report on the next refresh. |
| Built-in data governance | Data governance is built in. Sensitivity labels, access controls, and audit trails follow the data from source to dashboard. |
| Real-time intelligence | A workload for high-velocity event data. AgriERP uses this for live sensor feeds, equipment telemetry, and harvest scale data, where decisions are needed within seconds, not hours. |
Why this matters to you These capabilities are not custom-built. They are mature, fully managed products with documented uptime, security certifications, and global scale. By building the Analytics Layer on top of them, AgriERP inherits this reliability, governance, and ongoing innovation automatically.Your team gets the same analytics platform Fortune 500 companies use to run their business intelligence programs. Your IT team does not have to vouch for a custom analytics stack. The AgriERP team focuses on the agriculture-specific reporting and data models on top.
1. Reporting and dashboards
In one line Live, interactive dashboards and reports that turn farm activity, financial data, and grower commitments into clear, drill-down views, on the screen, on the go, and in the morning meeting.
Reports vs. dashboards
There is a clear distinction between reports and dashboards in AgriERP, and we use both. Understanding the difference helps explain how the analytics work.
| What it is | What it gives you |
|---|---|
| A report | A multi-page, interactive view of the data, with multiple visuals, filters, and drill-downs. Designed for exploration. Example: a season profitability report where you can filter by crop, by block, by season, and dig into individual cost lines. |
| A dashboard | A single-page, at-a-glance view of the most important metrics. Designed for monitoring. Example: a farm operations dashboard showing today’s work order status, equipment uptime, and harvest tonnage on one screen. |
What reporting delivers in AgriERP
The reporting platform’s standard capabilities are used inside AgriERP to deliver agribusiness reporting. The list below covers the features and how they show up in your daily work.
| Feature | What it does in AgriERP |
|---|---|
| Interactive visuals | Charts, tables, maps, KPI cards, and scorecards. Click any visual to filter all the others. The same drill-down experience applied to farm data. |
| Real-time refresh | Reports can be set to refresh on a schedule (hourly, daily) or in near real-time for live operational dashboards. The platform handles the refresh; you just see the latest numbers. |
| Mobile access | Reports designed for the desktop are also available, in mobile-optimised layouts, on the mobile app. Owners and managers see the same data on the road as in the office. |
| Email subscriptions and alerts | Set up scheduled email delivery of key reports. Set thresholds (“alert me if cost per acre goes 10% over budget”) and the system notifies the right person automatically. |
| Q&A in natural language | Natural-language Q&A lets users type questions like “yield per block this season” and get an answer as a chart. Works on AgriERP’s models out of the box. |
| Row-Level Security (RLS) | Standard security model, applied to data. A regional manager only sees their region. A grower only sees their own contracts. Enforced at the data layer, not the report layer. |
| Sensitivity labels and audit logs | Built-in governance ensures sensitive data is labelled, access is logged, and exports are tracked. Auditors see who looked at what and when. |
| Embedded reports | Reports can be embedded directly inside the Farm Web App, the Grower Portal, or any other AgriERP screen, so users do not need to switch applications to see data. |
Where AgriERP shapes reporting for agriculture
The platform provides the capability. AgriERP provides the agriculture-specific data models and the standard report library that runs on top. The list below covers the kinds of reporting AgriERP delivers out of the box.
- Operational dashboards: live status of work orders, crews, equipment, irrigation cycles, and harvest by farm and block.
- Yield and production reports: yield per block, per crop, per variety, per season, with comparisons to historical and budget.
- Cost and profitability reports: true cost per crop, margin per block, budget vs. actual by season, with drill-down to specific input lines.
- Resource utilisation reports: labor productivity, equipment uptime, input usage vs. plan, and idle time analysis.
- Grower performance reports: deliveries vs. contracts, quality results, on-time performance, settlement summaries by grower and program.
- Compliance and audit reports: spray records, re-entry tracking, certification status, traceability from pallet back to block.
2. The data foundation
In one line The unified data platform underneath the dashboards, where every piece of farm and business data is brought together, prepared, and made ready for analysis.
Why a separate data layer matters
Reporting tools are excellent at showing data, but they are not designed to be the place where data is stored, prepared, and managed. For that, you need a data platform underneath. Without one, every report ends up pulling directly from the operational systems, slowing them down, creating inconsistencies, and limiting what kind of analysis is possible.
The unified data foundation fills that role. It is where the data from the Core ERP Layer, the Mobile App, the Grower Portal, sensors, and external systems is consolidated, refined, and served to the reporting layer. AgriERP uses this foundation so that reporting is fast, consistent, and capable of going beyond simple charts into forecasting and AI-driven insight.
How the data layer is structured in AgriERP
AgriERP follows the recommended design pattern for unified analytics: the medallion architecture. It is a three-stage approach for incrementally improving the structure and quality of data, with three layers known as bronze, silver, and gold.
| Layer | What it contains |
|---|---|
| Bronze (raw) | Data lands here exactly as it comes from the source: ERP transactions, mobile app activity, sensor readings, integration messages. Original copies are preserved as the source of truth. |
| Silver (enriched) | Data is cleaned, validated, joined with master data (farms, blocks, crops, growers), and standardised. This is where raw activity becomes meaningful business events. |
| Gold (curated) | Data is shaped into the specific models that drive reports and dashboards. Pre-aggregated, optimised, and ready to query at speed. |
What the platform provides at each layer
| Capability | What it provides to AgriERP |
|---|---|
| Unified storage foundation | A single, unified data lake. All three layers (bronze, silver, gold) live in it, in an open data format. No data is copied between systems. |
| Data pipelines | Tools for moving and transforming data, used to bring data in from the operational sources and transform it through the medallion layers, on schedule or in real time. |
| Lakehouse and warehouse workloads | Storage and querying engines. Lakehouses handle high-volume operational data; warehouses handle relational, SQL-style analytics. AgriERP uses both. |
| Native SQL endpoint | An automatically generated SQL interface that lets reporting tools query the data foundation using standard SQL, without setting up a separate warehouse. |
| Real-time event workload | A workload for high-velocity event data, used for live sensor feeds and equipment telemetry that need to flow into dashboards within seconds. |
| Built-in governance | Built-in governance: sensitivity labels, access controls, lineage tracking, and audit logs that follow the data through every layer. |
Where AgriERP shapes the data foundation for agriculture
The platform provides the engines and the governance. AgriERP layers the agriculture-specific data models on top of it, the structures that make farm data analysable in the first place.
- Agriculture-specific master data: farms, blocks, sub-blocks, crops, varieties, seasons, growers, and contracts as standardised, governed entities, ready to be joined to any operational fact.
- Fact tables shaped for farms: harvest, work orders, applications (irrigation, spray, fertilizer), inventory movements, and labor hours, all structured around the agriculture business model.
- Pre-built semantic models: data models tuned for agribusiness reporting, so common metrics (yield per acre, cost per crop, margin per block) are calculated consistently across every report.
- Connectors for the AgriERP ecosystem: data feeds from the Mobile App, the Grower Portal, the Integration Layer, and the Core ERP Layer, set up and ready, not built from scratch.
3. Beyond dashboards: what becomes possible
With the reporting layer and the data foundation working together, the Analytics Layer can do more than just show what happened. The architecture supports the full analytics journey, from descriptive (what happened) to predictive (what will happen) to prescriptive (what should we do).
| Type of analytics | What it provides |
|---|---|
| Descriptive analytics | Standard reports and dashboards. What was the yield last week? What did we spend on Block 14? Built directly in the reporting layer, refreshed from the data foundation. |
| Diagnostic analytics | Drill-down and root-cause analysis. Why was yield down on Block 14? Interactive visuals plus joined data make this fast and intuitive. |
| Predictive analytics | Forecasting and scenario modelling. What will yield look like at the current pace? When will inventory run out? The data foundation supports machine learning natively, with Python, R, and AutoML. |
| Prescriptive analytics | Recommendations and optimisation. Which blocks should we prioritise tomorrow? What is the optimal spray window? Built on top of the data science workloads. |
How this connects to AgriERP’s AI Companion: The AI Companion in AgriERP is not a separate product. It draws its insights from the same data foundation described in this section. When the AI Companion forecasts yield, it is using a model trained on your historical data. When it suggests a spray window, it is reasoning over the same governed data your dashboards use.This means the AI does not have its own version of the truth. It uses the same numbers your finance team uses, the same numbers your operations team uses, and the same numbers your owners look at every morning.
4. The Analytics Layer in action
Here is what the Analytics Layer looks like in motion, for a single business question that is actually answered every day on a working farm.
| “Which blocks are at risk of missing budget this season?”It is mid-July. The owner asks the operations director that question over coffee. Data sources (Integration Layer + Core ERP): every cost from the General Ledger, every input deducted from inventory, every labor hour from the Mobile App, every sensor reading from the field, all flowing into AgriERP. Bronze layer (raw data): all of the above is landed in the bronze lakehouse, in raw form, with original timestamps and source IDs preserved. Silver layer (cleaned and joined): data is cleaned, validated, and joined to master data. Costs are tagged to the right block, crop, and season. Bad data is flagged. Gold layer (semantic model): data is aggregated into the agriculture-specific model: cost-per-block, cost-per-acre, budget-vs-actual, by crop, by season. Dashboard: the Season Budget Risk dashboard shows every block, sorted by current variance vs. budget. Red flags surface the top three. Drill-down: the operations director clicks Block 22. The view shows that input cost is 18% over plan, and that the spray program has run two cycles ahead. The reason is right there. Decision and action: the operations director adjusts the remaining spray schedule. The change flows back into work orders. The next refresh will show the impact on the budget.AgriERP shaped the visualisation and the data foundation for agriculture. One question, asked over coffee, answered with confidence. |
In summary
The Analytics Layer is what turns AgriERP from a system that records data into a system that helps the business make decisions. The reporting layer provides the dashboards, reports, and mobile access. The unified data foundation underneath provides ingestion, storage, transformation, and governance, all on a single platform. AgriERP shapes both of them for agriculture, with farm-aware data models, agribusiness-specific report libraries, and the data feeds that connect every other part of the platform.
The next section closes out the Platform Architecture, covering Data and Hosting, the infrastructure that all of this runs on, and the deployment options available to your business.