Data Analytics Solution of the Year” 2026 in Agtech Breakthrough Awards 2026


This document is a catalog of the financial reports AgriERP produces for agribusinesses, with a particular focus on the two questions every agribusiness CFO, finance director, and operations leader needs answered: how profitable is the business, and where is the cost going. It is the answer to “what financial reports will I actually get out of this system?” for finance teams, executives, boards, and the external parties (auditors, banks, investors) who care about the financial health of the business.
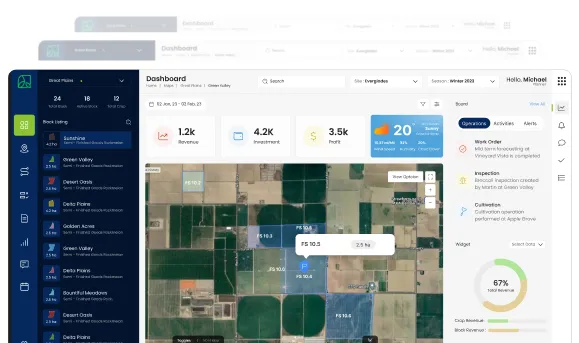
These reports are not the kind that get produced once a quarter from a finance team scrambling at month-end. They are reports the system produces on demand, refreshed in close to real time, from the same transactions that run the operation. The general ledger, the inventory subledger, the cost allocations, and the agricultural dimensions are all aligned continuously, which is why the reports are credible at any moment, not just after a long close cycle.
1. Profitability reports
Income statement and P&L
| Capability | What it means in practice |
|---|---|
| Standard income statement | Revenue, cost of goods sold, gross margin, operating expenses, operating income, net income. The conventional financial statement, generated from the General Ledger in real time. |
| By legal entity | Where the business runs multiple legal entities, an income statement per entity. Consolidation rolls them up to the group level with proper eliminations. |
| By business unit | Where the business is organised into business units (production, marketing, services), an income statement per unit. |
| By region or country | For multi-region operations, regional income statements with currency translation handled per accounting standards. |
| By period | Monthly, quarterly, year-to-date, full-year, with prior-period and prior-year comparison columns. |
| Budget comparison | Side-by-side with the budget, with variance columns showing both dollar variance and percentage variance. |
Crop and variety profitability
- P&L by crop: for each crop the business grows, the full P&L: revenue, direct cost, allocated overhead, gross margin, contribution after allocations. Year-on-year comparison.
- P&L by variety: within each crop, profitability per variety. Often more financially meaningful than the crop level because variety mix is a controllable decision.
- Margin per unit of output: margin per tonne, per kilogram, per carton, per pallet. The metric that drives commercial decisions.
- Margin per hectare or per acre: margin per unit of planted area. Useful for comparing crops as candidates for the same land.
- Cost contribution waterfall: from revenue to net contribution, every cost layer shown: direct inputs, direct labor, equipment, allocated overhead, packing, transport. Where the margin is being made or lost is visible at a glance.
- Sensitivity: how margin moves with a 5% change in price, 10% change in yield, 15% change in labor cost. The shape of the business model.
Customer, contract, and channel profitability
| Capability | What it means in practice |
|---|---|
| P&L by customer | For each customer, the full margin picture: revenue, cost of goods sold attributable to that customer’s deliveries, cost of serving (sales effort, freight, special handling), net contribution. Often the most surprising report on first run. |
| Top-N customer analysis | Top 10 customers by revenue alongside top 10 by margin. The two lists are often quite different. |
| P&L by contract | Where the business runs long-term contracts, profitability per contract. Useful when contracts come up for renewal. |
| P&L by channel | Domestic wholesale, export, retail, direct, processing. Channel-level margin including channel-specific costs. |
| P&L by buyer category | Premium retail, standard wholesale, juice processors, export. The relative profitability of each category drives commercial strategy. |
| Customer lifetime value | Over multiple seasons, the accumulated revenue and margin from each customer. Useful for retention and account-management priorities. |
Farm and program profitability
- P&L by farm: for multi-farm operations, profitability per farm. Performance variance between similar farms is often startling and instructive.
- P&L by program: where the business runs distinct programs (organic, conventional, certified, grower-supplied), profitability per program. Drives investment decisions in each.
- Block-level contribution: for the deepest drill, contribution per block. Some blocks lose money every season; identifying them is the first step to acting on them.
- Season comparison: season-over-season margin trends for the same farm and crop. The shape of the trajectory matters more than any single year.
2. Cost analysis reports
Cost by category
| Capability | What it means in practice |
|---|---|
| Inputs and materials | Spend on chemicals, fertilizers, seeds, packaging, fuel, and other materials, by category, by period, with year-on-year and budget comparison. |
| Direct labor | Wages, salaries, and benefits for production labor, broken down by activity (harvest, spray, prune, pack, transport). |
| Indirect labor and overhead | Supervision, agronomy, administration, support functions. Often the cost category that grows quietly without anyone noticing. |
| Equipment and infrastructure | Fuel, lubricants, repairs, parts, depreciation. By asset class and by farm. |
| Packing and processing | Packhouse labor, packaging, line consumables, packhouse overhead. The cost of turning harvested produce into saleable units. |
| Logistics and freight | Inbound freight (deliveries from suppliers) and outbound freight (deliveries to customers). Often a much larger cost than businesses realise. |
| Selling and administrative | Sales effort, marketing, head office, finance, IT, legal. The G&A layer that supports the operating business. |
| Finance costs | Interest, banking fees, factoring costs, foreign exchange impact. The cost of working capital. |
Cost by activity
- Cost per spray application: loaded cost per spray, by crop, by block, by season. Useful for benchmarking spray programs and identifying efficiency opportunities.
- Cost per harvest tonne: the cost of getting one tonne of harvest from the block to the packhouse, including labor, equipment, transport, supervision.
- Cost per pack: the cost of converting harvested produce into a packed unit (carton, tray, pallet), including labor, packaging, line operation, packhouse overhead.
- Cost per kilometre or per route: transport cost broken down by route, carrier, or self-fleet, with cost per kilometre as the comparable benchmark.
- Cost per work order: where work orders are uniform enough to compare (specific spray protocols, specific harvest activities), the cost per work order surfaces outliers.
Budget vs. actual
- By cost line and period: each budget line shows budget, actual, dollar variance, percentage variance, year-to-date and full-year. The fundamental management report.
- Drill-down to source: from a variance, drill down to the transactions: which purchase orders, which work orders, which payroll runs drove the over- or under-spend.
- Forecast remaining: given the year-to-date pattern, the projected full-year actual. Drives the conversation about whether action is needed.
- Re-forecast view: where the business has formally re-forecast, the report shows original budget, latest re-forecast, and actual, side by side.
- Significant variances list: lines exceeding the materiality threshold (configurable, e.g. >5% and >$10,000) flagged for management attention. The variance-by-exception report.
Variance attribution
- Price variance: for inputs where the budget assumed a specific price, the variance attributable to actual prices being higher or lower. Useful for procurement performance review.
- Volume variance: where the variance is driven by using more or less of the input. Often the more controllable component.
- Mix variance: where the cost mix differs from plan (more spray labor and less harvest labor than expected), the impact of the mix shift.
- Timing variance: where the cost was simply incurred earlier or later than planned, vs. truly higher or lower. Useful for separating real overspend from phasing.
3. Cash, working capital, and balance sheet reports
Balance sheet reports
- Standard balance sheet: assets (current and non-current), liabilities (current and non-current), equity. Generated from the General Ledger at any date.
- Comparative balance sheet: current period vs. prior period or prior year, with the change in each line item highlighted.
- Subledger-to-GL reconciliation: inventory, AR, AP, fixed assets, and other subledgers reconciled to their GL accounts. The continuous-reconciliation principle made visible.
- Working capital position: current assets minus current liabilities, with breakdown by component. The working-capital size and shape.
- Net debt position: total interest-bearing debt minus cash and equivalents. The leverage metric that banks and investors look at first.
Cash flow reports
- Standard cash flow statement: operating, investing, and financing cash flows, generated from GL movements. Available for any period.
- Cash flow forecast: projected cash position over the next weeks and months, based on open AR (expected receipts), open AP (expected payments), open PO commitments, scheduled payroll, planned capital spend. The forward view that drives liquidity management.
- Scenario cash flow: what-if cash flow under different scenarios: delayed customer payment, faster customer payment, additional capital investment, contract renewal at lower price.
- Seasonal cash cycle: for agriculture’s characteristic cash cycle (cost accumulating through the growing season, cash arriving in concentrated periods at harvest sale), the visual shape of the cycle. Useful for managing seasonal credit lines.
- Bank-by-bank cash position: where the business holds cash across multiple banks and currencies, a consolidated cash position with the underlying breakdown.
Working capital deep-dives
| Capability | What it means in practice |
|---|---|
| AR aging and DSO | Receivables by aging bucket (current, 30, 60, 90, 90+), with days sales outstanding trend over time. Underlying customer detail one click away. |
| AP aging and DPO | Payables by aging bucket, with days payable outstanding. Useful for cash flow planning and vendor relationship management. |
| Inventory days | Days of inventory on hand by category. High inventory days reveal stuck inventory; low days may reveal stockout risk. |
| Cash conversion cycle | DSO + inventory days minus DPO. The headline working capital metric for the operation. |
| Top overdue customers | The largest overdue balances, by customer, with aging and last-payment history. The collections work-list. |
| Concentration risk | Customer concentration on AR (top 5 customers as a share of total AR), vendor concentration on critical inputs. The risk view banks and auditors care about. |
4. Statutory, tax, and external reports
Tax reports
- VAT/GST returns: the periodic VAT or GST return prepared in the format the local authority requires, with input tax, output tax, and net amount due. Generated from the books, not from spreadsheets.
- Withholding tax reports: withholding tax deducted from vendor or grower payments, with the per-vendor breakdown and the consolidated total for remittance to the authority.
- Sales tax returns: where US-style sales tax applies, the multi-jurisdiction sales tax return with nexus rules applied correctly.
- Income tax reporting: the data required for income tax filings, including book-to-tax adjustments, depreciation reconciliation, and supporting schedules.
- Transfer pricing documentation: for multi-entity groups, the transactions between entities with the supporting cost basis, useful for transfer pricing documentation.
Statutory and compliance reports
- Statutory financial statements: balance sheet, income statement, cash flow statement, statement of changes in equity, in the format required by local accounting standards.
- Notes and disclosures support: the underlying detail for the standard disclosures: PP&E movements, intangible movements, related-party transactions, segment reporting, currency exposure.
- Audit pack: the bundle of supporting documentation external auditors need: trial balance, account analyses, reconciliations, sample transaction detail, contracts. Generated as a self-contained package.
- Bank covenant compliance: where the business has banking covenants (current ratio, debt-to-equity, EBITDA coverage), the reports that show compliance, periodically and on demand.
External stakeholder reports
- Investor reports: quarterly or periodic investor packs with the headline financials, operational metrics, and forward-looking commentary.
- Lender reports: for working-capital lenders and term-debt providers, the regular reporting they require: cash position, AR aging, inventory, financial covenants.
- Buyer audits and supplier scorecards: where major buyers require audit information or share supplier scorecards, the supporting reports the business needs to provide or respond to.
- Funder and donor reports: for programs supported by development funders or major buyers, the program-level financial reports in the formats they require.
- Insurance and risk reports: for crop insurance, asset insurance, or business interruption insurance, the supporting financial data for renewals and claims.
Why financial reports are different in agricultureGeneric ERP financial reports answer questions like “what was our revenue last quarter” and “how is our gross margin trending.” Useful, but not enough. An agribusiness has to be able to answer “what was our margin on grapes vs. apples this season,” “which farms are subsidising which other farms,” “how much working capital is locked in the 2027 mandarin season right now,” and “is the export channel still profitable after the freight cost increase.”The financial reports cataloged in this document are the answers. They exist because the same agricultural dimensions, crop, variety, season, farm, block, that drive operational reports also drive financial reports, all from the same set of underlying transactions. The CFO and the COO end up looking at numbers that agree, because they came from the same place.
In summary
Financial Reports in AgriERP cover profitability (income statement, P&L by crop, variety, customer, contract, channel, farm, program), cost analysis (cost by category, by activity, budget vs. actual, variance attribution), cash, working capital, and balance sheet (standard statements plus cash flow forecasting, working capital deep-dives), and statutory, tax, and external reports (VAT, withholding tax, income tax, statutory financials, audit pack, lender and investor reports, buyer audits, insurance support).
All these reports come from the same underlying data that runs the operation, with the agricultural dimensions and the financial framework aligned. The result is a reporting environment in which finance, operations, and external stakeholders see consistent numbers without separate reconciliation work, and in which the financial picture is current, not weeks-old.